Diversity at every level

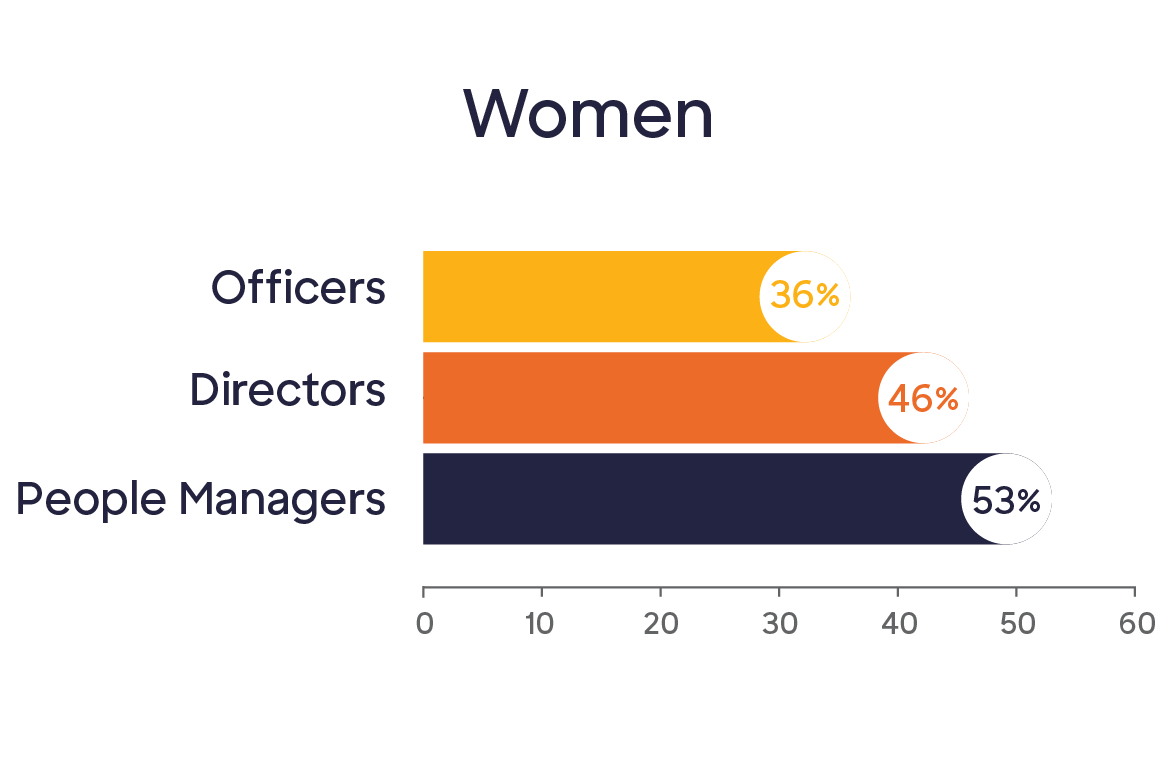
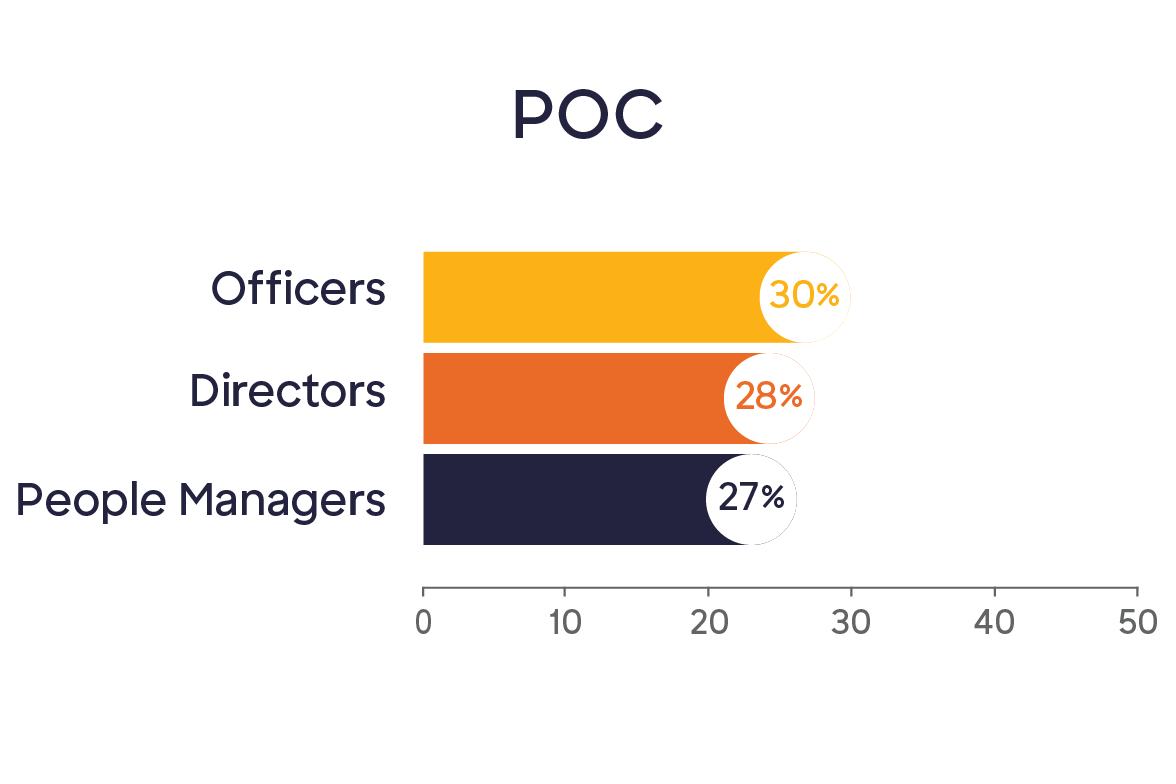
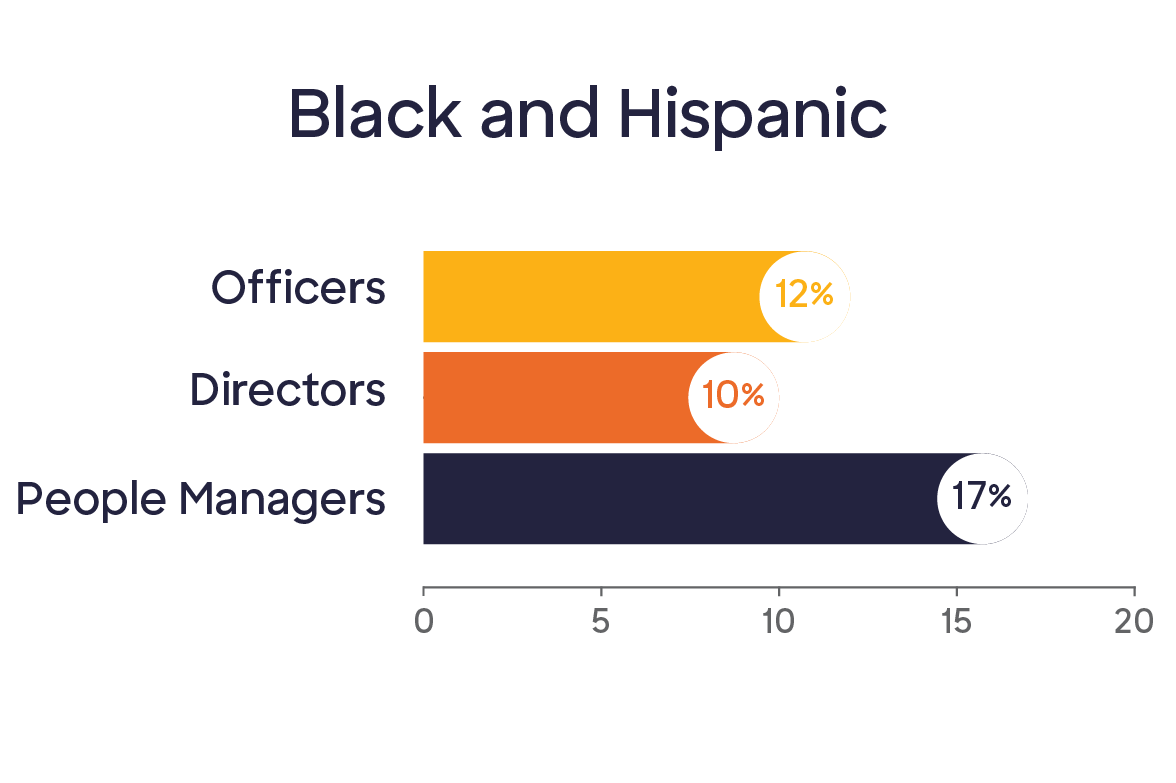
2022 leadership: gender and race/ethnicity1
We achieved our largest gains in women and POC2 representation since 2018.
- Largest increase in women Directors—up 5 percentage points from 41% to 46%.
- Increase in POC People Managers—up 3 percentage points from 24% to 27%.
- Highest increase in Black and Hispanic People Managers—up 3 percentage points from 14% to 17%.
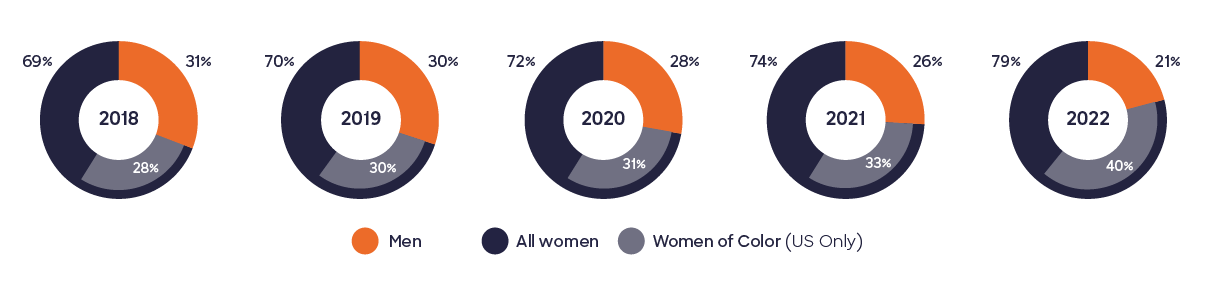
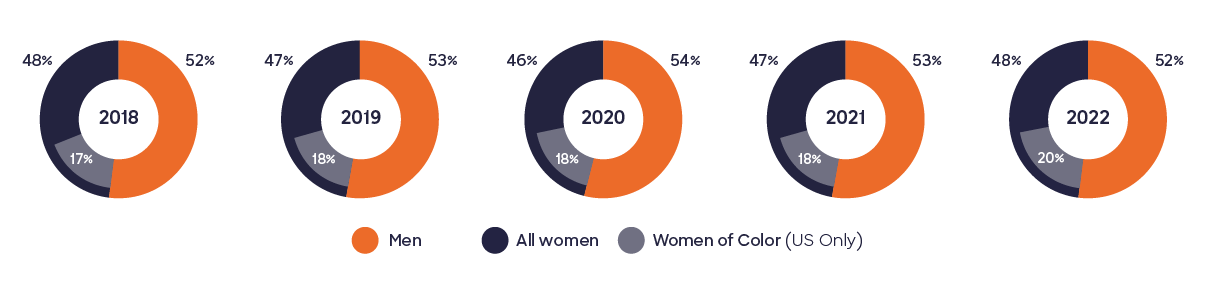
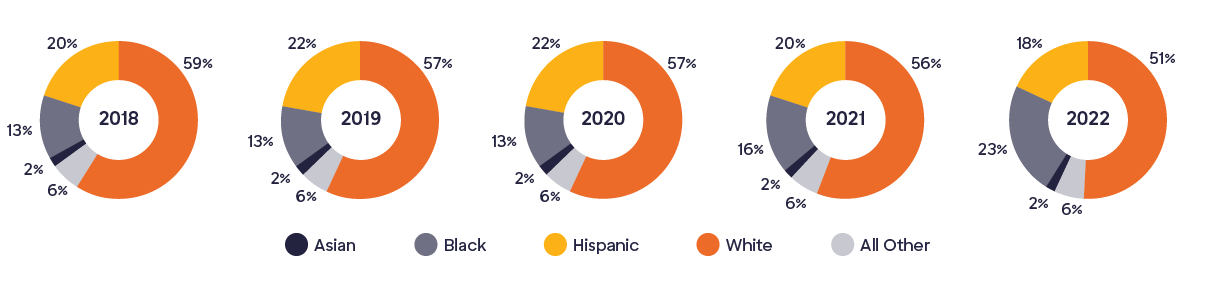
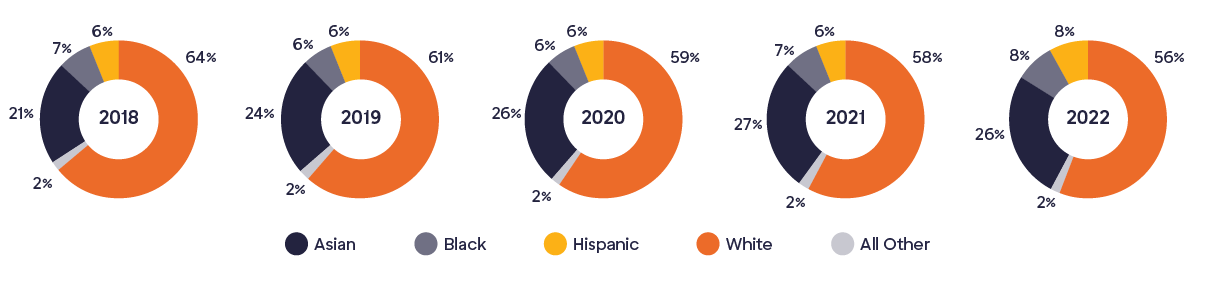
From 2018 to 2022: employee representation over time3
Race/Ethnicity
Gender
Hourly
Salary
Pay equity
Women and minorities at Discover earn, on average, between $0.99-$1.03 for every $1.00 earned by men and non-minorities.
After accounting for factors such as role, tenure, and geography.
Inclusion
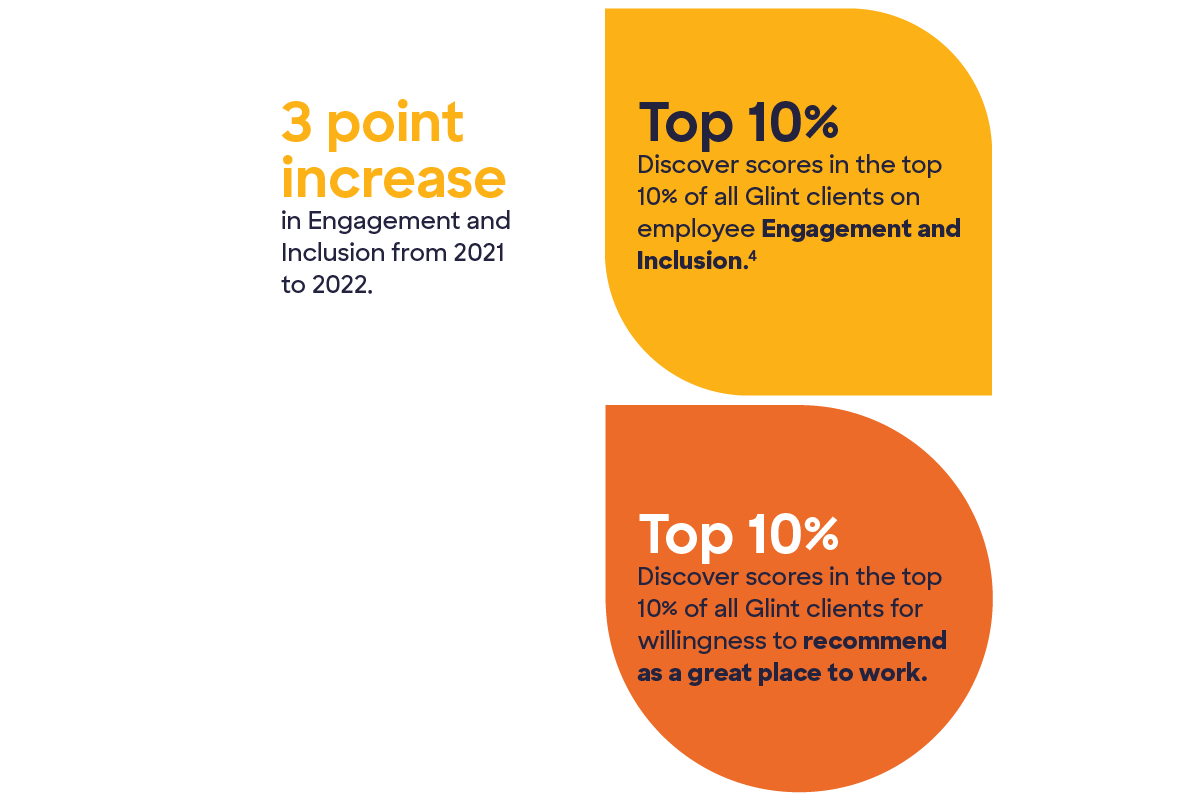
We want to honor every part of employees’ unique identities and give each one a voice. We are proud to have achieved an Inclusion Index score of 80 or above for all identity groups.
- Pay Equity
- Inclusion
For more information about DE&I at Discover, download the Social section from our 2022 ESG Report.
Download Social Section
Updated 05/15/2023
1 Chart notes
- Current data on gender is measured men/women. We recognize this does not represent the full spectrum of gender identities, but we are matching to the external benchmark. Results from our self-ID campaign indicate that .17% of the Discover® population identifies as nonbinary.
- Officers are comprised of the Executive Vice President, Senior Vice President, and Vice President population. People Managers are employees who have a supervisory role but not Directors or above. Individual Contributors are employees whose FLSA status is Exempt and do not have a supervisory role. Comparisons to system(s) of record, both current and historical, may vary due to rounding and/or transactional changes.
- Discover partners with an independent, third-party consultant to conduct a company-wide pay equity analysis that considers race, ethnicity, and gender.
- Data as of December 31 for each year listed.
- POC is defined as People of Color; POC comprises all races/ethnicities in the United States that are not categorized as White/Caucasian.
2 POC is defined as People of Color; POC comprises all races/ethnicities in the United States that are not categorized as White/Caucasian.
3 Chart notes
- Current data on gender is measured men/women. We recognize this does not represent the full spectrum of gender identities, but we are matching to the external benchmark. Results from our self-ID campaign indicate that .17% of the Discover population identifies as nonbinary.
- Comparisons to system(s) of record, both current and historical, may vary due to rounding and/or transactional changes.
- Discover partners with an independent, third-party consultant to conduct a company-wide pay equity analysis that considers race, ethnicity, and gender.
- Data as of December 31 for each year listed.
- POC is defined as People of Color; POC comprises all races/ethnicities in the United States that are not categorized as White/Caucasian.
4 Engagement as an index of the two items Discover measures (employee satisfaction and willingness to recommend as a great place to work). Discover Inclusion Index is an aggregate measure of Authenticity, Belonging, Equal Opportunity, and Team Inclusion.